การสร้างตัวแบบเชิงคณิตศาสตร์เกี่ยวกับสถานะตลาดหุ้น โดยใช้ระบบ สมการเชิงผลต่าง
Main Article Content
บทคัดย่อ
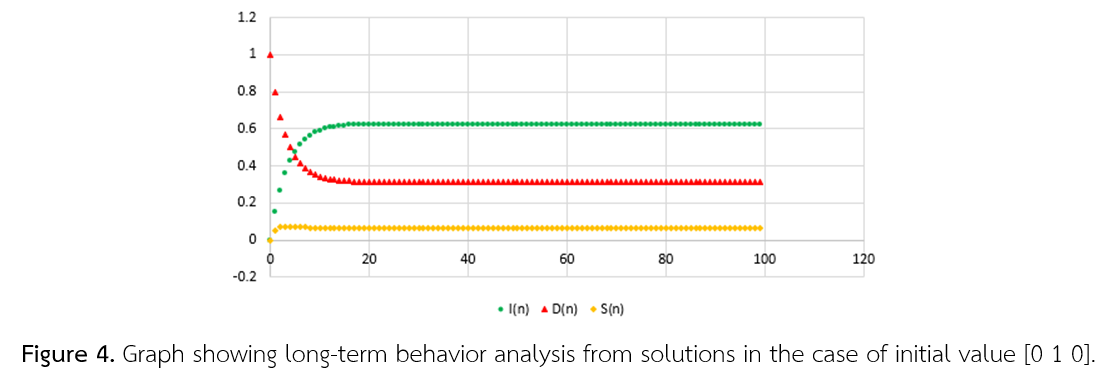
การวิจัยครั้งนี้มีวัตถุประสงค์เพื่อนำเสนอการสร้างตัวแบบเชิงคณิตศาสตร์ของสถานะตลาดหุ้นโดยใช้ระบบสมการเชิงผลต่าง เริ่มต้นด้วยการศึกษารูปแบบการวิเคราะห์ในรูปลูกโซ่มาร์คอฟแล้วแปลงเป็นระบบสมการเชิงผลต่าง ซึ่งสามารถพิจารณาผลเฉลยเชิงวิเคราะห์ แตกต่างจากการหาผลเฉลยตัวแบบที่อยู่ในรูปลูกโซ่มาร์คอฟ ที่ต้องอาศัยวิธีการเชิงตัวเลข เพื่อหาผลเฉลยเชิงตัวเลข ในขั้นตอนการพิจารณาผลเฉลยของระบบสมการเชิงผลต่างนั้น มีการใช้โปรแกรมวูลแฟรมแอลฟา เพื่อช่วยหาสมการลักษณะเฉพาะ ค่าเจาะจง และค่าเวกเตอร์เจาะจง และมีการใช้โปรแกรมไมโครซอฟท์เอกซ์เซล ในการหาผลเฉลยเชิงตัวเลข และการแสดงกราฟของผลเฉลย สำหรับตัวแบบเชิงคณิตศาสตร์เกี่ยวกับสถานะหุ้นนั้น มีการพิจารณาสถานะเป็น ตลาดขาขึ้น ตลาดขาลง และตลาดหยุดนิ่ง การวิเคราะห์สถานะเพื่อให้เห็นพฤติกรรมระยะยาว กรณีหุ้นที่นำมาศึกษานี้ มีการพิจารณาค่าเริ่มต้นของสถานะ 3 กรณี คือ [1 0 0] , [0 1 0] และ [0 0 1] ซึ่งผลการศึกษาพบว่าพฤติกรรมระยะยาวของสถานะหุ้นที่มีค่าเริ่มต้นทั้ง 3 กรณีได้ผลลัพธ์เหมือนกัน คือ มีความน่าจะเป็นของสถานะตลาดขาขึ้นเป็น 0.6250 ตลาดขาลงเป็น 0.3125 และตลาดหยุดนิ่ง 0.0625 ชี้ให้เห็นว่าเมื่อเวลาผ่านไปหุ้นที่นำมาศึกษามีความน่าจะเป็นที่จะเป็นตลาดขาขึ้น ซึ่งจะเป็นข้อมูลสารสนเทศเชิงคณิตศาสตร์ที่มีประโยชน์ข้อมูลหนึ่งเพื่อใช้พิจารณาร่วมกับข้อมูลด้านอื่นในการซื้อขาย
Article Details
วารสารวิทยาศาสตร์และวิทยาศาสตร์ศึกษา (JSSE) เป็นผู้ถือลิสิทธิ์บทความทุกบทความที่เผยแพร่ใน JSSE นี้ ทั้งนี้ ผู้เขียนจะต้องส่งแบบโอนลิขสิทธิ์บทความฉบับที่มีรายมือชื่อของผู้เขียนหลักหรือผู้ที่ได้รับมอบอำนาจแทนผู้เขียนทุกนให้กับ JSSE ก่อนที่บทความจะมีการเผยแพร่ผ่านเว็บไซต์ของวารสาร
แบบโอนลิขสิทธิ์บทความ (Copyright Transfer Form)
ทางวารสาร JSSE ได้กำหนดให้มีการกรอกแบบโอนลิขสิทธิ์บทความให้ครบถ้วนและส่งมายังกองบรรณาธิการในข้อมูลเสริม (supplementary data) พร้อมกับนิพนธ์ต้นฉบับ (manuscript) ที่ส่งมาขอรับการตีพิมพ์ ทั้งนี้ ผู้เขียนหลัก (corresponding authors) หรือผู้รับมอบอำนาจ (ในฐานะตัวแทนของผู้เขียนทุกคน) สามารถดำเนินการโอนลิขสิทธิ์บทความแทนผู้เขียนทั้งหมดได้ ซึ่งสามารถอัพโหลดไฟล์บทความต้นฉบับ (Manuscript) และไฟล์แบบโอนลิขสิทธิ์บทความ (Copyright Transfer Form) ในเมนู “Upload Submission” ดังนี้
1. อัพโหลดไฟล์บทความต้นฉบับ (Manuscript) ในเมนูย่อย Article Component > Article Text
2. อัพโหลดไฟล์แบบโอนลิขสิทธิ์บทความ (Copyright Transfer Form) ในเมนูย่อย Article Component > Other
ดาวน์โหลด ไฟล์แบบโอนลิขสิทธิ์บทความ (Copyright Transfer Form)
เอกสารอ้างอิง
Albright, B. and Fox, W. P. (2019). Mathematical modeling with Excel. Boca Raton, FL: CRC Press.
Andrieu, C., Doucet, A. and Holenstein, R. (2010). Particle markov chain monte carlo methods. Journal of the Royal Statistical Society: Series B (Statistical Methodology), 72(3), 269-342.
Bidabad, B. and Bidabad, B. (2019). Complex probability and Markov stochastic process. Indian Journal of Finance and Banking, 3(1), 13-22.
Brooks, S., Gelman, A., Jones, G. and Meng, X. L. (Eds.). (2011). Handbook of Markov chain Monte Carlo. Boca Raton, FL: CRC press.
Fox, W. P. (2011). Mathematical modeling with Maple. Nelson Education, Belmont, CA: Brooks/Cole Publishing.
Giordano, F. R., Fox, W. P. and Horton, S. B. (5ed, 2013). A first course in mathematical modeling (5th ed.), Nelson Education , Belmont, CA: Brooks/Cole Publishing.
Myers, D., Wallin, L., Wikström, P. (2017) An introduction to Markov chains and their applications within finance. Sweden: Mathematical Sciences - Chalmers University of Technology and University of Gothenburg, Retrieved 10 September 2020, from Chalmers tekniska högskola och Göteborgs Universitet: http://www.math.chalmers.se/Stat/Grundutb/CTH/mve220/1617/redingprojects16-17/IntroMarkovChainsandApplications.pdf, 21. 03. 2019, str. 1-8
Svoboda, M. and Lukas, L. (2012). Application of Markov chain analysis to trend prediction of stock indices. In Proceedings of 30th International Conference Mathematical Methods in Economics (pp. 848-853). Karviná: Silesian University, School of Business Administration.
Vasanthi, S., Subha, M. V. and Nambi, S. T. (2011). An empirical study on stock index trend prediction using Markov chain analysis. Journal of Banking Financial Services and Insurance Research, 1(1), 72-91.
Yu, K. and Sato, T. (2019). Modeling and analysis of error process in 5G wireless communication using two-state Markov chain. IEEE Access, 7, 26391-26401.
Zhang, D. and Zhang, X. (2009). Study on forecasting the stock market trend based on stochastic analysis method. International Journal of Business and Management, 4(6), 163-170.


