ผลของการจัดการเรียนรู้แบบสืบเสาะหาความรู้ร่วมกับการใช้อินโฟกราฟิกที่มีต่อความสามารถในการสร้างคำอธิบายเชิงวิทยาศาสตร์ของนักเรียนกลุ่มชาติพันธุ์
Article Sidebar
Main Article Content
บทคัดย่อ
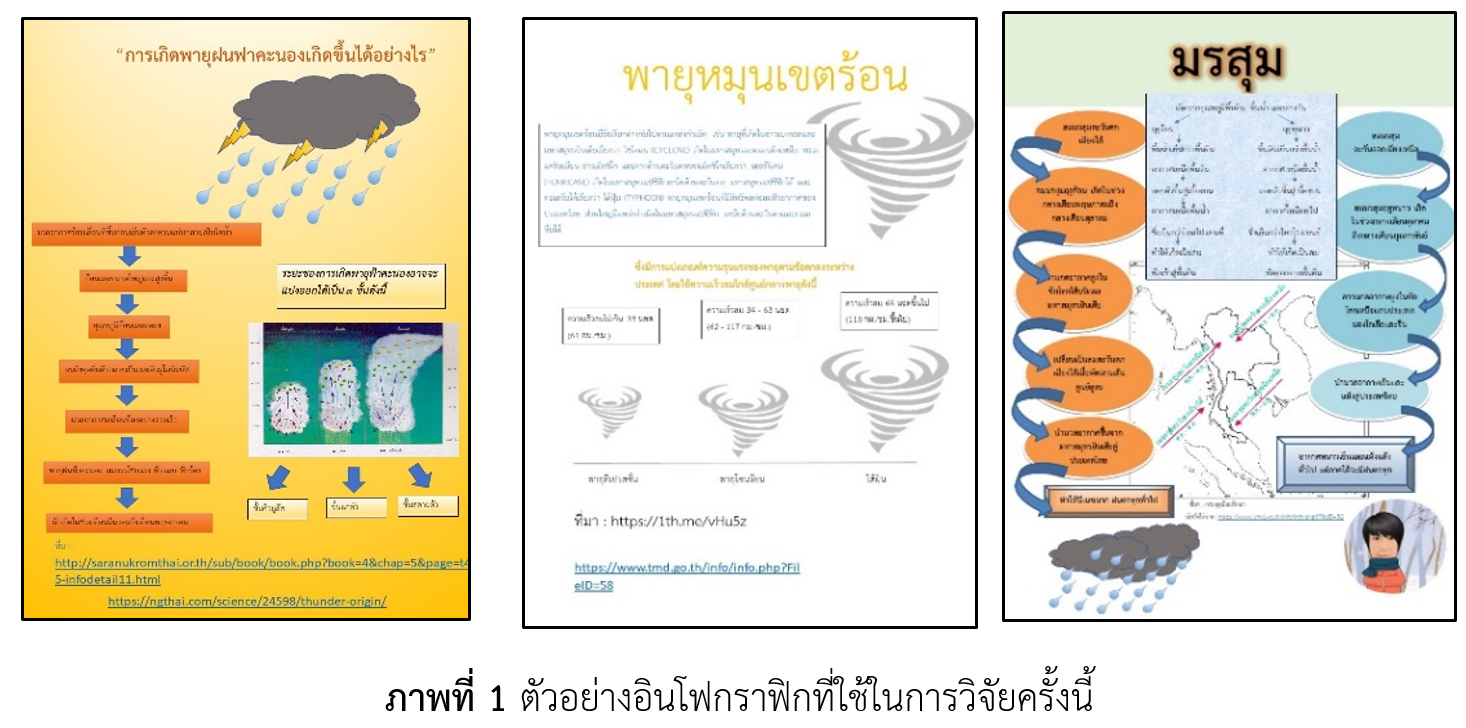
การวิจัยครั้งนี้ มีวัตถุประสงค์เพื่อศึกษาผลของการจัดการเรียนรู้แบบสืบเสาะหาความรู้ร่วมกับการใช้ อินโฟกราฟิกที่มีต่อความสามารถในการสร้างคำอธิบายเชิงวิทยาศาสตร์ของนักเรียนกลุ่มชาติพันธุ์ เรื่อง ลม ฟ้า อากาศ กลุ่มศึกษาที่ใช้ในงานวิจัย ได้แก่ นักเรียนชั้นมัธยมศึกษาปีที่ 1 โรงเรียนแห่งหนึ่งในอำเภออมก๋อย จังหวัดเชียงใหม่ ภาคเรียนที่ 2 ปีการศึกษา 2562 จำนวน 6 คน ดำเนินการวิจัยโดยใช้ระเบียบวิธีวิจัยแบบวิเคราะห์ข้อมูลเชิงคุณภาพร่วมกับสถิติบรรยาย เครื่องมือที่ใช้ในการวิจัย ได้แก่ แผนการจัดการเรียนรู้จำนวน 7 แผน แบบวัดความสามารถในการสร้างคำอธิบายเชิงวิทยาศาสตร์โดยการสัมภาษณ์ จำนวน 4 ข้อ วิเคราะห์ข้อมูลโดยใช้การแบ่งระดับคำตอบ แต่ละองค์ประกอบของคำอธิบายเชิงวิทยาศาสตร์เป็นค่าร้อยละ ผลการวิจัยพบว่า นักเรียนส่วนใหญ่มีความสามารถในการสร้างคำอธิบายเชิงวิทยาศาสตร์อยู่ในระดับดีถึงร้อยละ 66.67 ระดับดีมากร้อยละ 16.67 และควรปรับปรุงร้อยละ 16.67 โดยพิจารณาแต่ละองค์ประกอบ พบว่า นักเรียนทำคะแนนในองค์ประกอบด้านข้อกล่าวอ้างได้มากที่สุดคิดเป็นร้อยละ 77.08 รองลงมาองค์ประกอบด้านหลักฐานนักเรียนทำคะแนนได้คิดเป็นร้อยละ 54.71 และองค์ประกอบด้านการให้เหตุผลนักเรียนทำคะแนนได้น้อยที่สุดคิดเป็นร้อยละ 41.67 ผลที่ได้แสดงผลจากการจัดการเรียนรู้แบบสืบเสาะหาความรู้ร่วมกับการใช้อินโฟกราฟิกนั้นเน้นให้นักเรียนได้ตอบคำถามในรูปแบบของการสร้างคำอธิบายเชิงวิทยาศาสตร์ โดยประเด็นที่ต้องเน้นเพิ่มเติมคือการให้เหตุผลเพื่อเชื่อมโยงคำอธิบายไปยังหลักฐานหรือประจักษ์พยานที่ใช้ในการสร้างคำอธิบายนั้น
Article Details
วารสารวิทยาศาสตร์และวิทยาศาสตร์ศึกษา (JSSE) เป็นผู้ถือลิสิทธิ์บทความทุกบทความที่เผยแพร่ใน JSSE นี้ ทั้งนี้ ผู้เขียนจะต้องส่งแบบโอนลิขสิทธิ์บทความฉบับที่มีรายมือชื่อของผู้เขียนหลักหรือผู้ที่ได้รับมอบอำนาจแทนผู้เขียนทุกนให้กับ JSSE ก่อนที่บทความจะมีการเผยแพร่ผ่านเว็บไซต์ของวารสาร
แบบโอนลิขสิทธิ์บทความ (Copyright Transfer Form)
ทางวารสาร JSSE ได้กำหนดให้มีการกรอกแบบโอนลิขสิทธิ์บทความให้ครบถ้วนและส่งมายังกองบรรณาธิการในข้อมูลเสริม (supplementary data) พร้อมกับนิพนธ์ต้นฉบับ (manuscript) ที่ส่งมาขอรับการตีพิมพ์ ทั้งนี้ ผู้เขียนหลัก (corresponding authors) หรือผู้รับมอบอำนาจ (ในฐานะตัวแทนของผู้เขียนทุกคน) สามารถดำเนินการโอนลิขสิทธิ์บทความแทนผู้เขียนทั้งหมดได้ ซึ่งสามารถอัพโหลดไฟล์บทความต้นฉบับ (Manuscript) และไฟล์แบบโอนลิขสิทธิ์บทความ (Copyright Transfer Form) ในเมนู “Upload Submission” ดังนี้
1. อัพโหลดไฟล์บทความต้นฉบับ (Manuscript) ในเมนูย่อย Article Component > Article Text
2. อัพโหลดไฟล์แบบโอนลิขสิทธิ์บทความ (Copyright Transfer Form) ในเมนูย่อย Article Component > Other
ดาวน์โหลด ไฟล์แบบโอนลิขสิทธิ์บทความ (Copyright Transfer Form)
เอกสารอ้างอิง
Allen, S. (1997). Using scientific inquiry activities in exhibit explanations. Science education, 81(6), 715-734.
Bybee, R. W. (2006). Scientific inquiry and science teaching. In L. B. Flick & N. G. Lederman (Eds.), Scientific inquiry and nature of science (pp. 1-14). Springer, Dordrecht.
Chamrat, S. (2019). The design and development of stem for life, economy and society materials and learning activity. Veridian E-Journal, Silpakorn University (Humanities, Social Sciences and arts), 12(2), 1150-1170.
Chaowakeratipong, N. (2019). Enhancing the ability in constructing scientific explanations of learners by using the inquiry teaching Method (in Thai). STOU Education Journal, 12(1), 40-54.
Gebre, E. (2018). Learning with multiple representations: Infographics as cognitive tools for authentic learning in science literacy. Canadian Journal of Learning and Technology, 44(1).
Institute for the Promotion of Teaching Science and Technology. (2016). Summary of research results of the TIMSS 2015 project (in Thai). Retrieved 2 April 2019, from Trends in International Mathematics and Science Study: http://timssthailand.ipst.ac.th/timss/reports.
Lomklang, S., Tanahoung, C., Wuttisela, W. and Wutiprom, S. (2021). The study of mental model through drawing about solar system for grade-4 students (in Thai). Journal of Science and Science Education, 4(1), 107-117.
McNeill, K. L. and Krajcik, J. (2008). Inquiry and scientific explanations: Helping students use evidence and reasoning. In Luft, J., Bell, R. L., & Gess-Newsome, J. (Eds.), Science as Inquiry in the Secondary Setting (pp.121-134). NSTA Press.
Metz, K. (2000). Young children’s inquiry in biology: Building the knowledge bases to empower independent inquiry. In Minstrell, J. and van Zee, E. (Eds.), Inquiring into Inquiry Learning and Teaching in Science (pp. 371-404). Washington, D.C: AAAS.
Ministry of Education. (2017). Indicators and concepts in science subject (revision B.E.2560) according to basic education core curriculum B.E. 2551 (in Thai). Bangkok: Chumnumsahakorn Karnkaset.
National Research Council. (1996). National science education standards. National Academies Press.
National Science Technology and Innovation Policy Office. (2015). Background of the institution (in Thai). Retrieved 7 April 2019, from http://www.sti.or.th/about.php?content_type=2.
Office for promotion of the learning society and the quality of youth. (2020). Infographic: the new storytelling tools (in Thai). Retrieved 20 March 2019, from http://www.qlf.or.th/Home/Contents/300.
O'donoghue, T. (2006). Planning your qualitative research project: An introduction to interpretivist research in education. Routledge.
Pananchai, K., Matarat, P., Tamuang, S. and Supasorn, S. (2018). Eleventh grade students’ conceptual understanding and mental models on chemical equilibrium from learning by using inquiry incorporated with predict-observe-explain technique (in Thai). Journal of Science and Science Education, 1(1), 49-60.
Ruiz-Primo, M. A., Li, M., Tsai, S. and Schneider, J. (2008). CRESST Report 733: Testing one premise of scientific inquiry in science classrooms: A study that examines student’s scientific explanation. Los Angeles: University of California.
Sakurada, J. (2015). Basic infographic (in Thai). Nonthaburi: DC Premier.
Samakoses, V. (2013). Infographics help with learning (in Thai). Retrieved 2 March 2019, from Bangkok Biz News: https://www.bangkokbiznews.com/blog/detail/490933.
Science Teachers’ Association of Ontario. (2006). Position paper: The Nature of Science, 1-2. Ontario: SCCAO Helping Science Happen.
Vanichvasin, P. (2015). Potentials of using Infographics in Enhancing the quality of Learning (in Thai). Panyapiwat Journal, 7(special), 227-240.
Wangthaphan, T., Chanchampa C. and Wonsawas, W. (2018). The study “lipid and protein” of grade 10 students’ by using 5e inquiry model to enhance scientific explanation skills (in Thai). Proceedings of 2nd of Suansunandha Rajabhat University (pp.346-353). Bangkok: Suan Sunandha Rajabhat University.
Worakhot, J., Chansawang, N. and Tabtimsai, C. (2018). Examining high school student-generated explanations on acid-base (in Thai). Proceedings of 4th Faculty of Information and Technology Rajabhat MahaSarakham University Research Conference (pp.49-55). Maha Sarakham: Rajabhat Maha Sarakham University.
